Data display tools
Each data display includes common tools that help with analyzing data and modifying the appearance. Graph displays (Line Graph, Bar Graph, Scope, and FFT) include additional tools that are specifically useful for graphs.
-
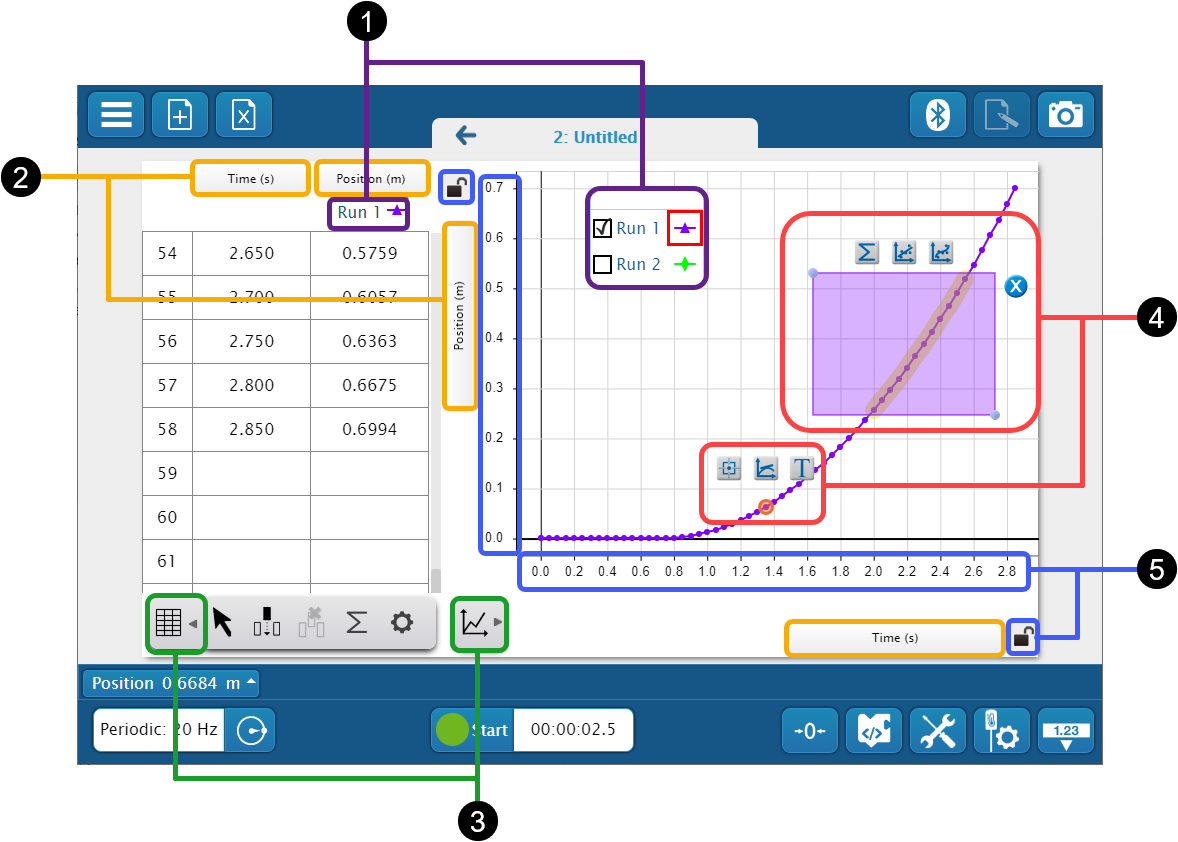
Run selector
Click to select a run to show in the display.
For graph displays, click the check box to show
 or hide
  a run. When analyzing a run, first select the colored run icon to make the run active. The active run is indicated by a red box.
 -
Measurement selector
Click any measurement in a display to change the measurement or its units. In the measurement selection pane, select a measurement to display, or select the unit to change the units. If you want to display user-entered or calculated data, select the User-entered tab at the top of the pane.
-
Toolbar drawer
Click to show or hide the display's toolbar. Each display includes analysis tools specific for that display. Select a tool in the drawer to activate it in the display.
-
In-context tools
Graph displays include analysis tools in the plot area for easy access. These are the same tools found in the toolbar. The tools that appear depends on whether you select a single data point or drag over a range of data.
-
Single data point
Select a single data point, then select either the coordinates
 , slope
  , or annotation
  tool. After selecting the tool, you can select a different data point by clicking the left
  and right
  arrows. Click
  to remove the tool.
 -
Range of data
Drag over a range of data, then select the statistics
 , linear fit
  , or curve fit
  tool. Click to remove the tool.
-
-
Axes scale
Drag across an axis to change the scale of the axis. To prevent the axis from scaling, click the lock icon
 . You can also drag the plot area to move the plot.