Table display
Display data using two or more columns and show data statistics.
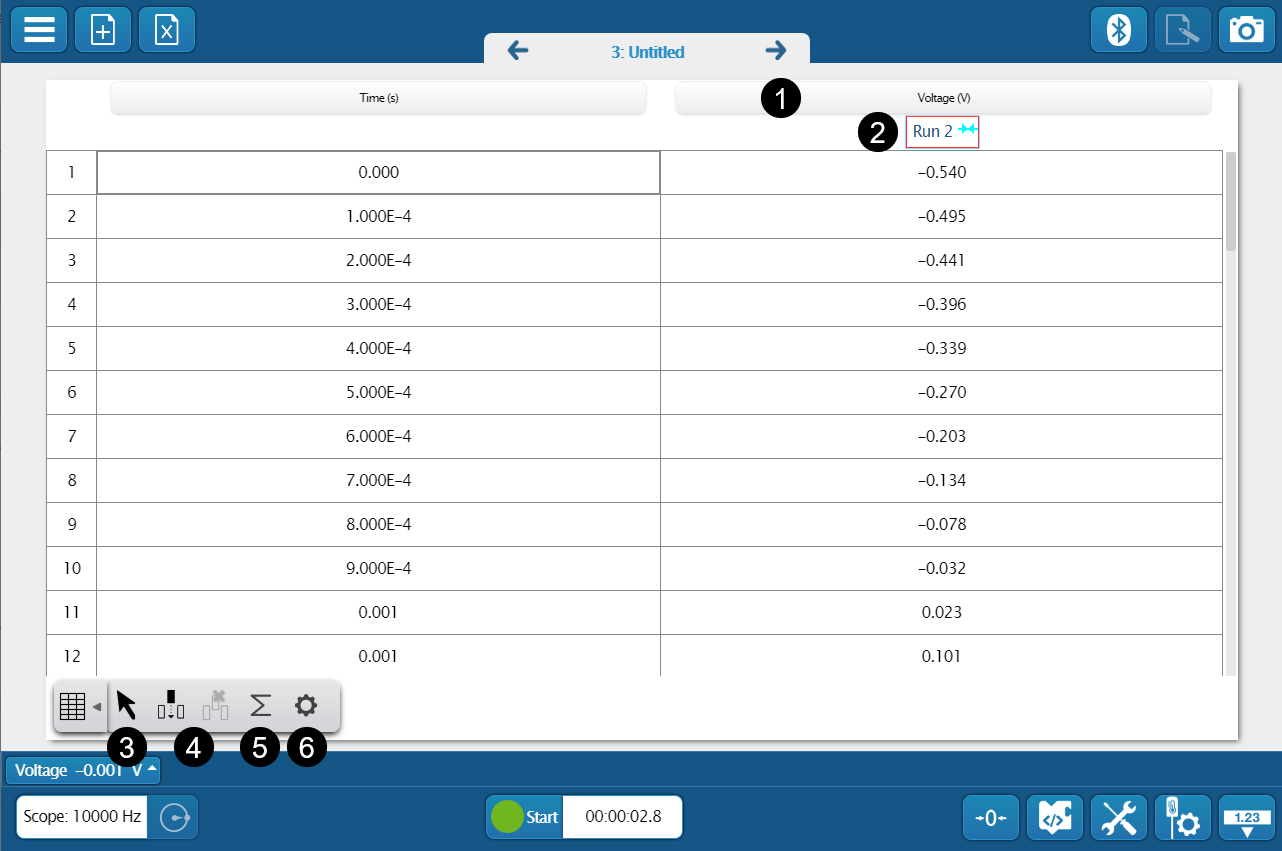
Overview
-
Measurement Selector
Click to change the displayed measurement or units.
-
Run Selector
Click to change the displayed run.
-
 Selection Tool
Use this tool to select table cells when using the Statistics and Remove Column tools.
-
Add or Remove Columns
Click
 to add a column to the table. To remove a column, use the select tool to select a column, then click
  .
. -
 Statistics Tool
Use the statistics tool to display the minimum, maximum, mean, and standard deviation of the column of data.
-
 Properties
Open the properties to toggle the visibility of the row numbers.
Add a column
Go to  and click .
This adds a new column to the end of the table. To add a column to a different location in the table:
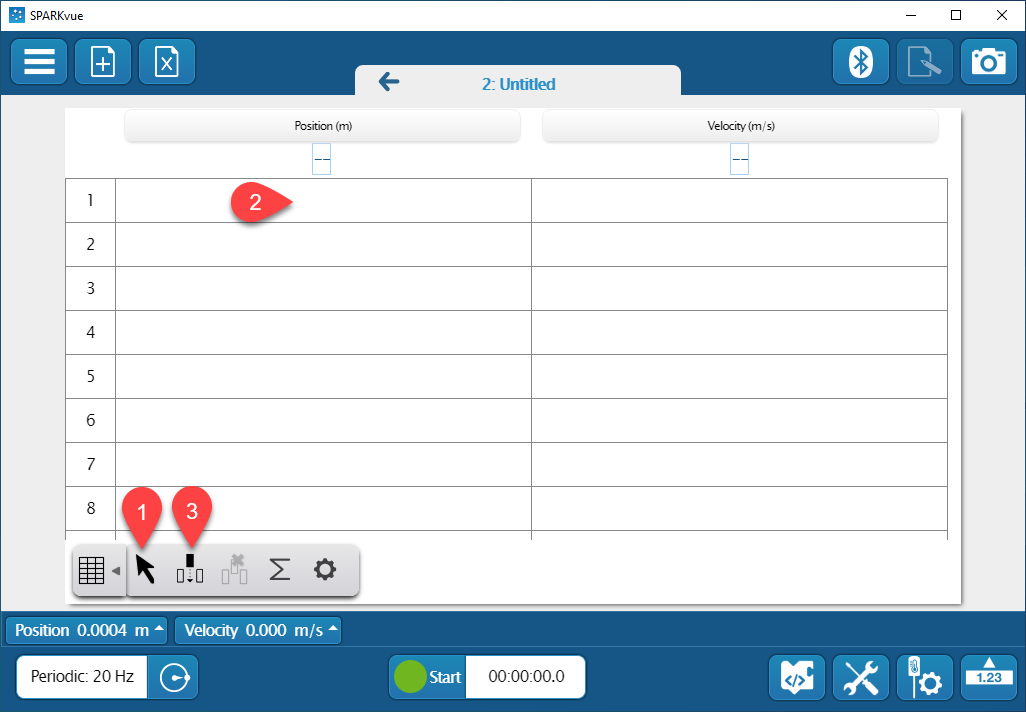
- Go to and click .
- Select a cell in the column to the right of where you want to insert a new column.
- Click .
After you insert a new column, click Select Measurement to designate a measurement for that column.
Remove a column
Note
Removing a column of data does not delete the data itself. If you want to delete data, see Delete Data Runs.
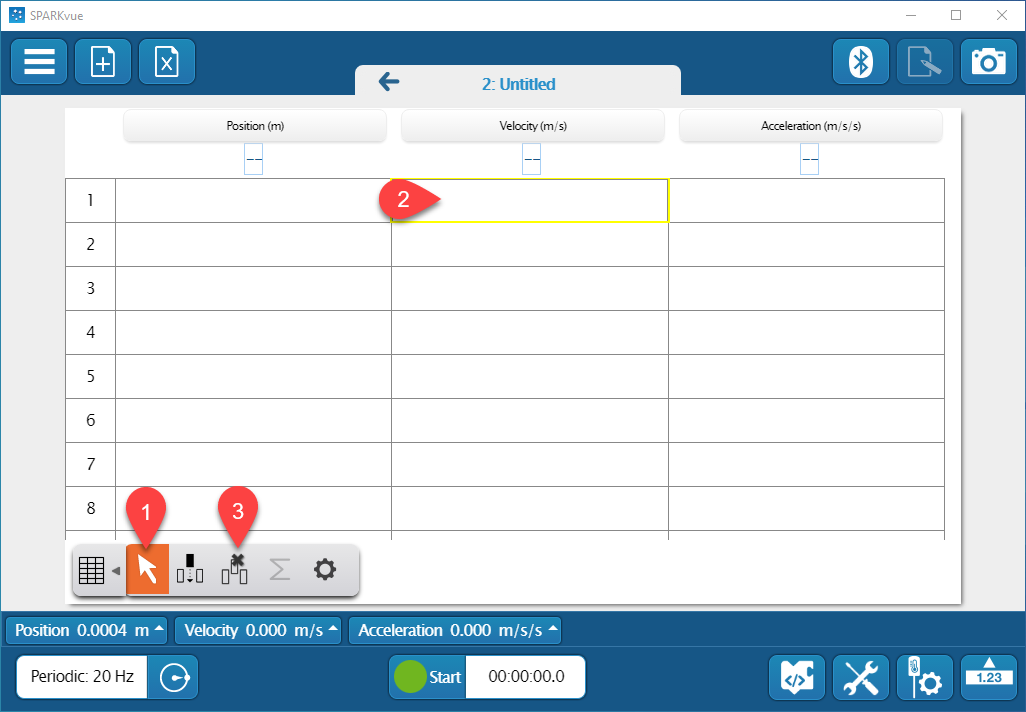
- Go to and click .
- Select a cell the column you want to remove.
- Click .
- Click OK to confirm.
Change the name and units of user-entered data
Note
Changes made to the measurement name and units in the table carry over to other displays.
-
Click the pencil
 next to the name of the measurement you want to edit.
 -
Enter a new name in the Measurement field.
Tip
Click Symbols
 or Greek Letters
  to enter special characters, including subscripts and superscripts.
 -
Optional: Enter the units for the measurement in the Units field.
-
Click OK.
Show statistics of a measurement
Use the statistics tool to display the minimum, maximum, mean, and standard deviation of data and display it at the bottom of the column.
- Go to and click .
- Select one or more statistics you want to display, then click OK. The table displays the statistics at the bottom of each column.
- Optional: To display the statistics for a range of measurements, click , then click and drag over the table cells you want to analyze.