Set up and control the Signal Generator
Use the Signal Generator tool to control a signal generator on the 550 Universal Interface and the Wireless AC/DC Module.
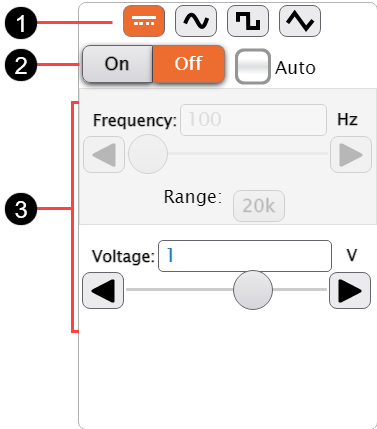
Overview
-
Waveform
Select the type of waveform the signal generator outputs:
-
DC

Outputs a constant voltage equal to the Voltage.

-
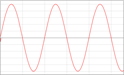
Sine

Outputs an sinusoidal oscillation with positive and negative peaks equal to the Amplitude.
-
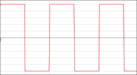
Square

Outputs an oscillation that remains at a constant positive and negative voltage equal to the Amplitude. The voltage is positive for half of the oscillation and negative for the other half of the oscillation.
-
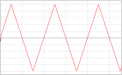
Triangle

Outputs a linear oscillation with positive and negative peaks equal to the Amplitude.
-
-
Power Control
Control the signal generator power manually, automatically with data collection, or with a program in the Code tool:
- Click the On and Off buttons to control the power manually.
- Select the Auto checkbox to have the power automatically turn on when you click Start
 and automatically turn off when you click Stop
  .
.
-
Waveform Parameters
Set the waveform parameters manually by entering a number in the box, clicking arrows, or dragging the slider. You can also use sensors to control the parameters by creating a program using the Code tool. The following parameters are available:
-
Frequency
Sets how often the waveform oscillates each second. Click the Range button to change the maximum frequency.
-
Amplitude
Sets the positive and negative peak voltages.
-
Display the output waveform
Use the Signal Generator tool and Scope display to an output waveform from a signal generator.
- On the Welcome Screen, click Sensor Data.
- Connect your device to SPARKvue.
- Click Cancel to return to the Welcome Screen.
- Click Build New Experiment on the Welcome Screen.
-
Select the 1/3-2/3 layout.

-
For the 1/3 section, select
 .
. - For the 2/3 section, select one of the following:
- Select
 for DC or low-frequency sampling.
 - Select
 for high-frequency sampling.
- Select
- In the control panel, select a waveform.
- Select Auto in the power control so that the signal generator automatically turns on while recording data.
- Set the Frequency and Amplitude of the waveform.
- If using the 550 Universal Interface, enable the Output Voltage sensor:
- On the bottom of the signal generator, click
 .
. - Toggle Record Output Voltage to On.
- Click OK.
- On the bottom of the signal generator, click
- In the data display, click Select Measurement then select Output Voltage.
- Click Start to display the waveform on the data display. Use the Graph or Scope display tools to adjust the display.