Manually enter data in a graph
Enter non-sensor data into a table and display in a graph.
-
Open SPARKvue, or click
 and select Start New Experiment.
 -
Click Manual Entry:

-
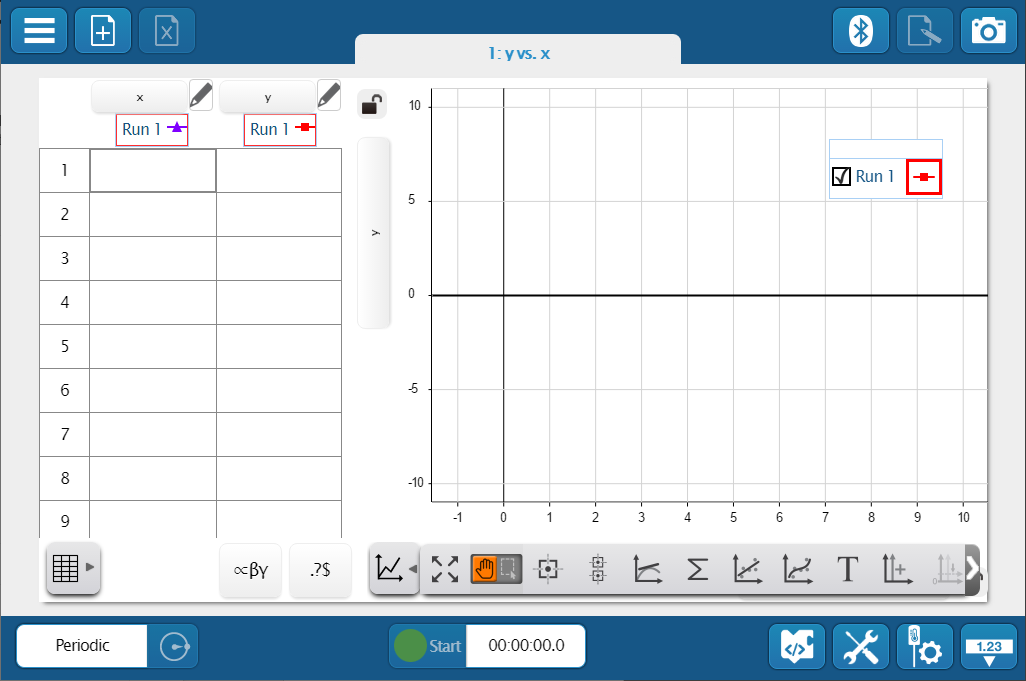
Enter data values for x and y in row 1 of the table. A data point appears on the graph.
-
Repeat for additional data points.
Tip
Use the Tab key on your keyboard to quickly move between cells when entering data.
-
Use the graph and table tools to change the appearance or analyze the data.