Bar Graph display
Compare manually-sampled measurements across categories.
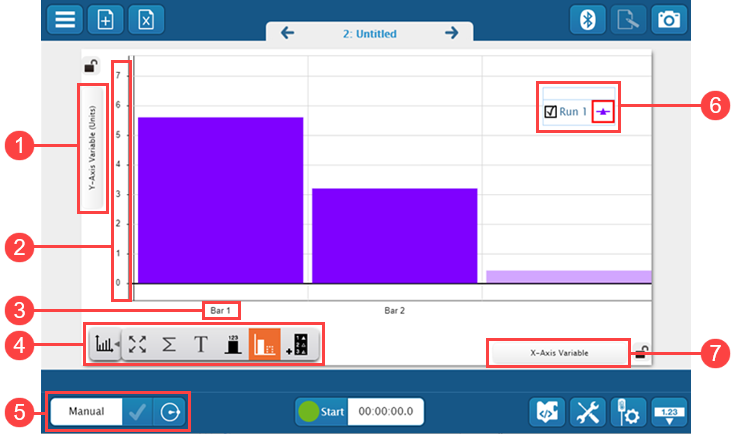
Displaying data in a bar graph is useful when you want to compare a single sensor measurement between different categories, such as measuring the pH of several different chemicals. If you want to compare values across multiple sensors of the same type of measurement, a bar meter display would be more appropriate.
-
Y-Axis Variable
Click to select a measurement to display on the y-axis. This is typically a sensor measurement.
-
Y-axis
Drag to manually scale the y-axis.
-
Bar name
Click the bar above the bar name to change the name.
-
Bar graph tools
-
 Scale to Fit Tool
Click to scale the graph to fit all of the data.
-
 Statistics Tool
Click to display statistics for the current run such as maximum, minimum, mean, and standard deviation.
-
 Annotation Tool
Add a note to a bar. Click to turn on the tool then click a bar to add a note to.
-
 Show digits
Click to show the digits of the measurement above each bar.
-
 Show next bar
Click to show the next bar. Click this bar to add a new data point when displaying user-entered data on the Y-axis.
-
 Add a run
Click to add a new run of data. This is only active when the Y-axis is displaying user-entered data.
-
-
Manual entry
Manual sampling is automatically selected when using a bar graph. After clicking Start
 , click the check
  to record a measurement.
 -
Legend
Use the legend to identify, display, and select runs to analyze. Select the checkbox to show or hide runs. For analysis, the selected run is indicated by a red box.
-
X-Axis Variable
Click to select a measurement to display on the x-axis. This is typically user-entered data.
Collect data
- Click Y-Axis Variable then select a measurement to display on the y-axis.
-
Click X-Axis Variable. The X-Axis variable is typically user-entered data, which means you need to create a User-entered measurement:
- Click the User-entered tab.
- Click Create Data Set.
-
Enter a Measurement Name for the Data Set, then click OK.
Note
You can also configure the other Data Set options, but it is not required.
-
Click Start
to begin data collection. - Take a measurement with your sensor. Once you are done with the measurement, click the check to record the measurement. A second bar now appears.
- Repeat the previous step for all of your data samples. Click Stop
 when finished.