Scope display
Create a display that functions as a digital oscilloscope. This display is useful for viewing measurements that oscillate rapidly in time such as electrical signals and sound waves.
Note
When building a new page, connect a supported sensor to show the Scope as a selectable display option.
Overview
-
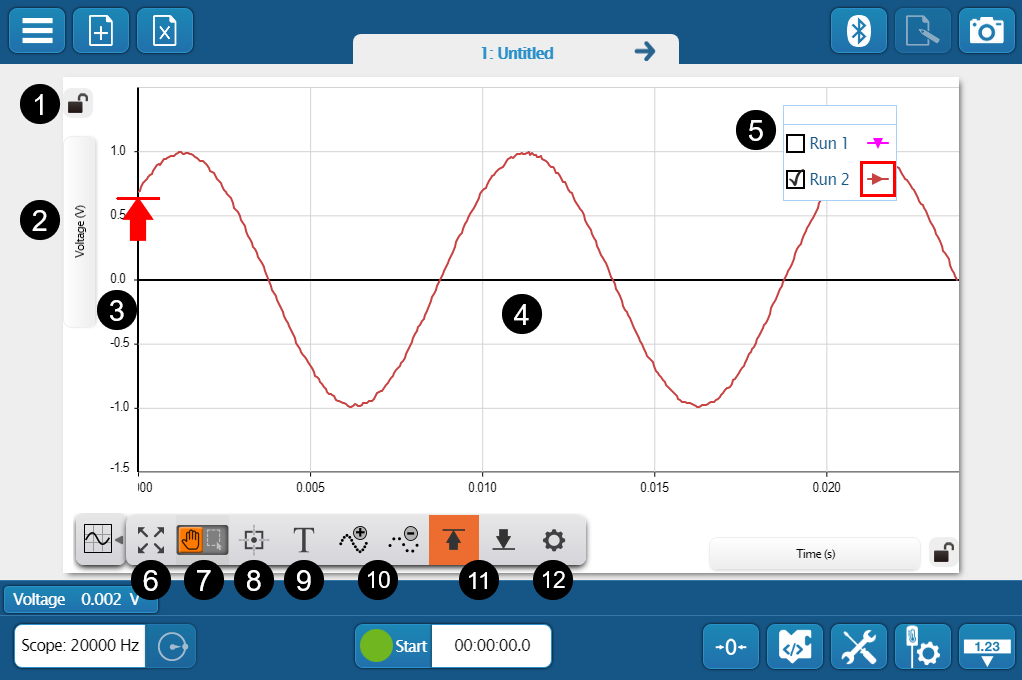
 Axis Lock
Click to lock
 or unlock axis scaling.
 -
Measurement Selector
Click to change the displayed measurement or units.
-
Axis
Click and drag to scale each axis individually.
-
Plot Area
Click and drag to move the plot area.
-
Legend
Select a run to analyze by clicking the run in the legend. Right-click the run symbol to change the run color and other data set properties.
-
 Scale to Fit Tool
Change the scale of a line graph to zoom in on a range of data or to view an entire run of data.
-
 Cursor Mode
Click to toggle the function of the mouse cursor.
-
Switch to Move Mode
to use the cursor to move the plot area. -
Switch to Select Mode
 to highlight an area on the plot for data analysis.
-
-
 Coordinates Tool
Use to determine the coordinates of a single data point. Use the delta tool to determine the difference between two points of data.
-
 Annotation Tool
Use the annotation tool to label a data point in a graph with a brief note.
-
Data Point Tools
Use these tools to increase
 or decrease
  the number of data points in a trace. Increasing the number of data points makes a smoother trace but decreases the displayed range of the trace.
 -
Trigger Tools
Use the scope trigger to get a stable trace. Click
 to use a positive edge trigger or click
  to use a negative edge trigger .
 -
 Properties
Change the visibility of data points, symbols, and lines connecting data points in a line graph.
Get a stable trace
Use the trigger to get a stable trace on the scope display.
- Click Start
 .
. -
Click
or to activate the scope trigger. The trigger icon appears on the y-axis of the scope display.Tip
A positive edge trigger displays the trace as the signal is rising at the trigger point. A negative edge trigger displays a trace as the signal is falling at the trigger point.
-
Drag the trigger along the y-axis to the value that the signal must pass for data recording to start.
Supported Sensors
You can use the Scope display with the following devices: