Collect, visualize, and analyze data
Learn how to set up a sensor, collect and analyze data, and save an experiment. If you are new to SPARKvue, start here!
In this tutorial, we're going to use a Wireless Temperature Sensor to measure the temperature of a cup of water. If you don't have a Wireless Temperature Sensor, you can still follow the steps in this tutorial to collect data with a different Wireless sensor.
Connect the sensor
Connect the sensor to SPARKvue and select a template for displaying the data.
-
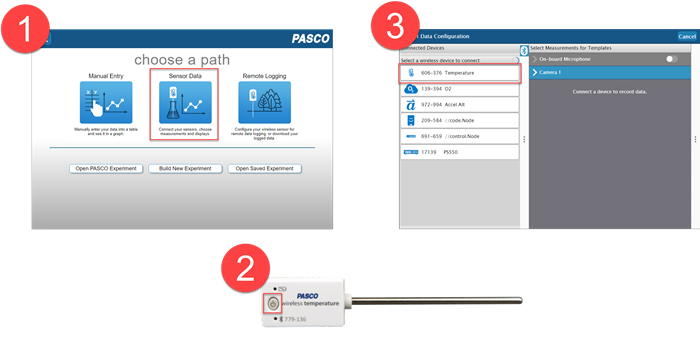
On the Welcome Screen, click Sensor Data.
-
Turn on the sensor by pressing the power button until the lights turn on.
-
On the Sensor Data Configuration screen, check the list of available wireless devices on the left. Click the sensor that matches the device ID printed on the sensor to connect it to SPARKvue.
Tip
SPARKvue lists the sensors in order of proximity to the device running the program, so your sensor is likely at the top of the list.

-
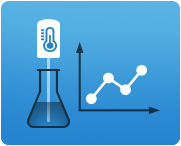
Under Templates, click Graph.
Note
For multi-measurement sensors, you can also select which measurement you want to display by selecting the box next to the measurement's name. In this case, we only have one measurement that is selected by default.
Collect data
Record a run of data and view the results on the Graph display.

-
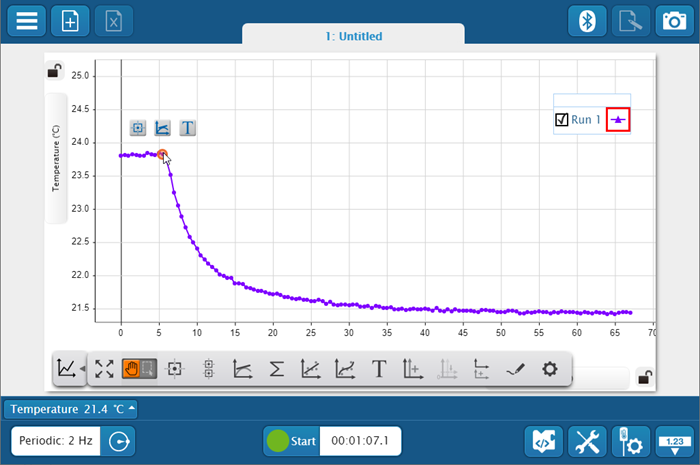
On the Experiment Screen, click Start
 to begin recording data.
 -
Place the sensor probe in a cup of water.
-
Once the sensor reaches equilibrium, click Stop
 to finish recording data.
 -
Adjust the viewing area of the graph by dragging the axes. You can also click the scale-to-fit tool
 to automatically scale the graph.
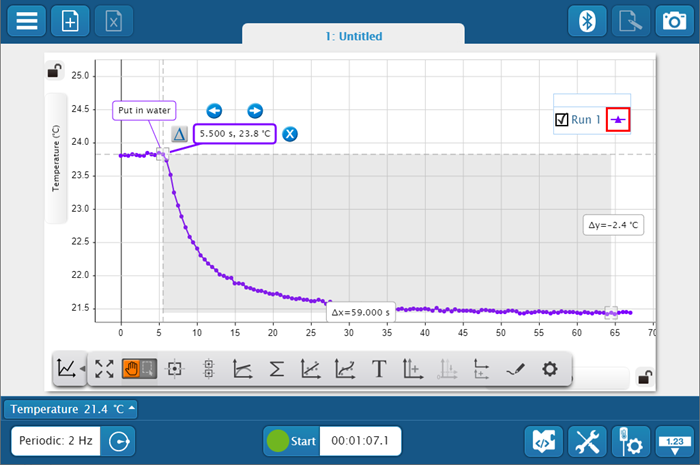
Add a note
Add a note to a data point to add context to the graph.
-
Click a data point to add a note. A selection of tools appears.
-
Click the annotation tool
 to add an annotation to that point.
 -
Select the Enter Note box, then use your keyboard to type a note.
-
Click OK when finished. The note appears on the graph.
Tip
Reposition the annotation by dragging the text box.
Find data coordinates
Determine the coordinates of a data point and the difference between two points on the graph.
-
Click a data point to analyze.
-
Click the coordinates tool
 . A box displaying the coordinates appears.
 -
Click the coordinates box, then click the delta tool
 . A second coordinates box appears.
 -
Drag the second coordinates box to a new location to determine the difference between the two points. Boxes showing the difference in y and the difference in x appear.
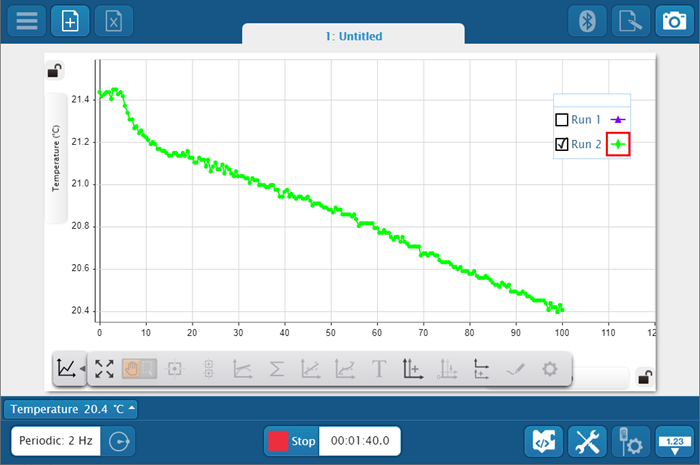
Collect a second run
Record a second data run and compare it to the first run.
-
Click Start
to begin recording a second data run. The first data run is hidden. -
Remove the Temperature Sensor probe from the water and set it on the table.
-
After several minutes, click Stop
to end recording data. -
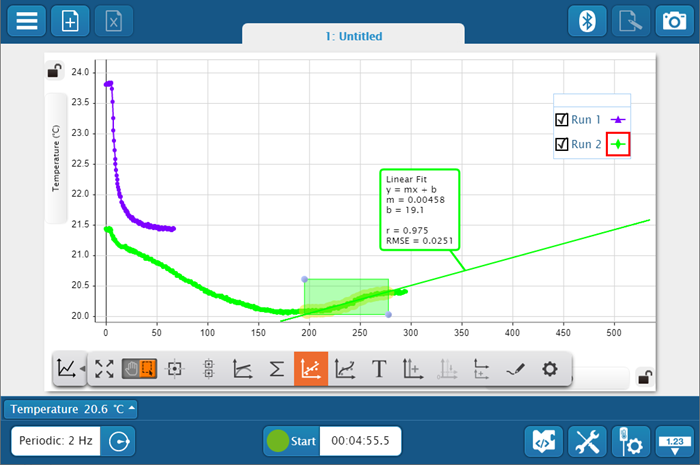
In the graph legend, select the Run 1 box
 to make the first run visible.
Fit the data to a line
Add a linear fit to a selection of the data to find the slope and y-intercept.
-
Toggle the cursor tool to selection mode
 .
. -
Drag the cursor across the graph to select a portion of the graph to analyze.
-
Select the linear fit tool
 to fit a line to the selection. A line appears with a box displaying the slope, y-intercept, and error values.
Tip
Drag the axes to see a projection of the linear fit.
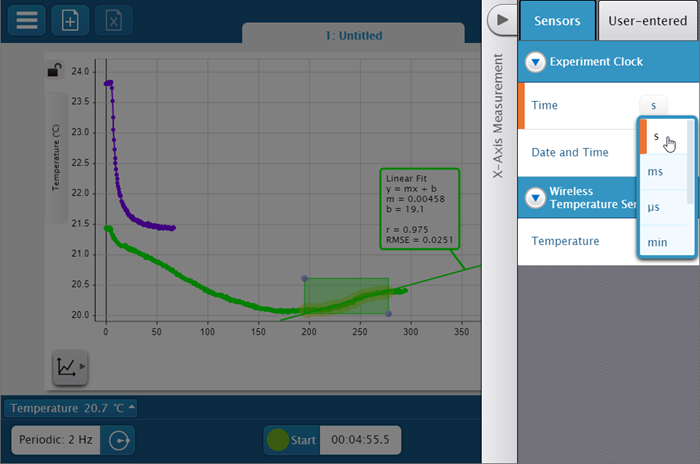
Change the units of the Time axis
Change the units of the Time measurement from seconds to minutes to make the data easier to read.
- Click the toolbar drawer
 to collapse the toolbar.
 - Click Time (s) on the x-axis to open the X-Axis Measurement panel.
- Click the s box next to Time, then select min from the dropdown list.
Save the data
Save your experiment file to share with others.
- Click on
 , then select Save As.
 - Create a name for your file, then save it on your device.
Tip
On mobile devices, you can directly email your file by tapping the share tool  and selecting Share SPARKlab.
To open your file at a later time, click Open Saved Experiment on the Welcome Screen.
Next steps
Now that you've gone over the basics of collecting data in SPARKvue, here are some suggestions to learn more about SPARKvue:
- Explore the graph display tools.
- Explore the Experiment Screen tools.
- Build a new experiment page.
- Use the search feature at the top of this page to find a specific topic.