Create and display calculated data
Create an equation using sensor measurements and view the calculated data in a display.
Create a calculation
Use the Calculator to create equations and constants.
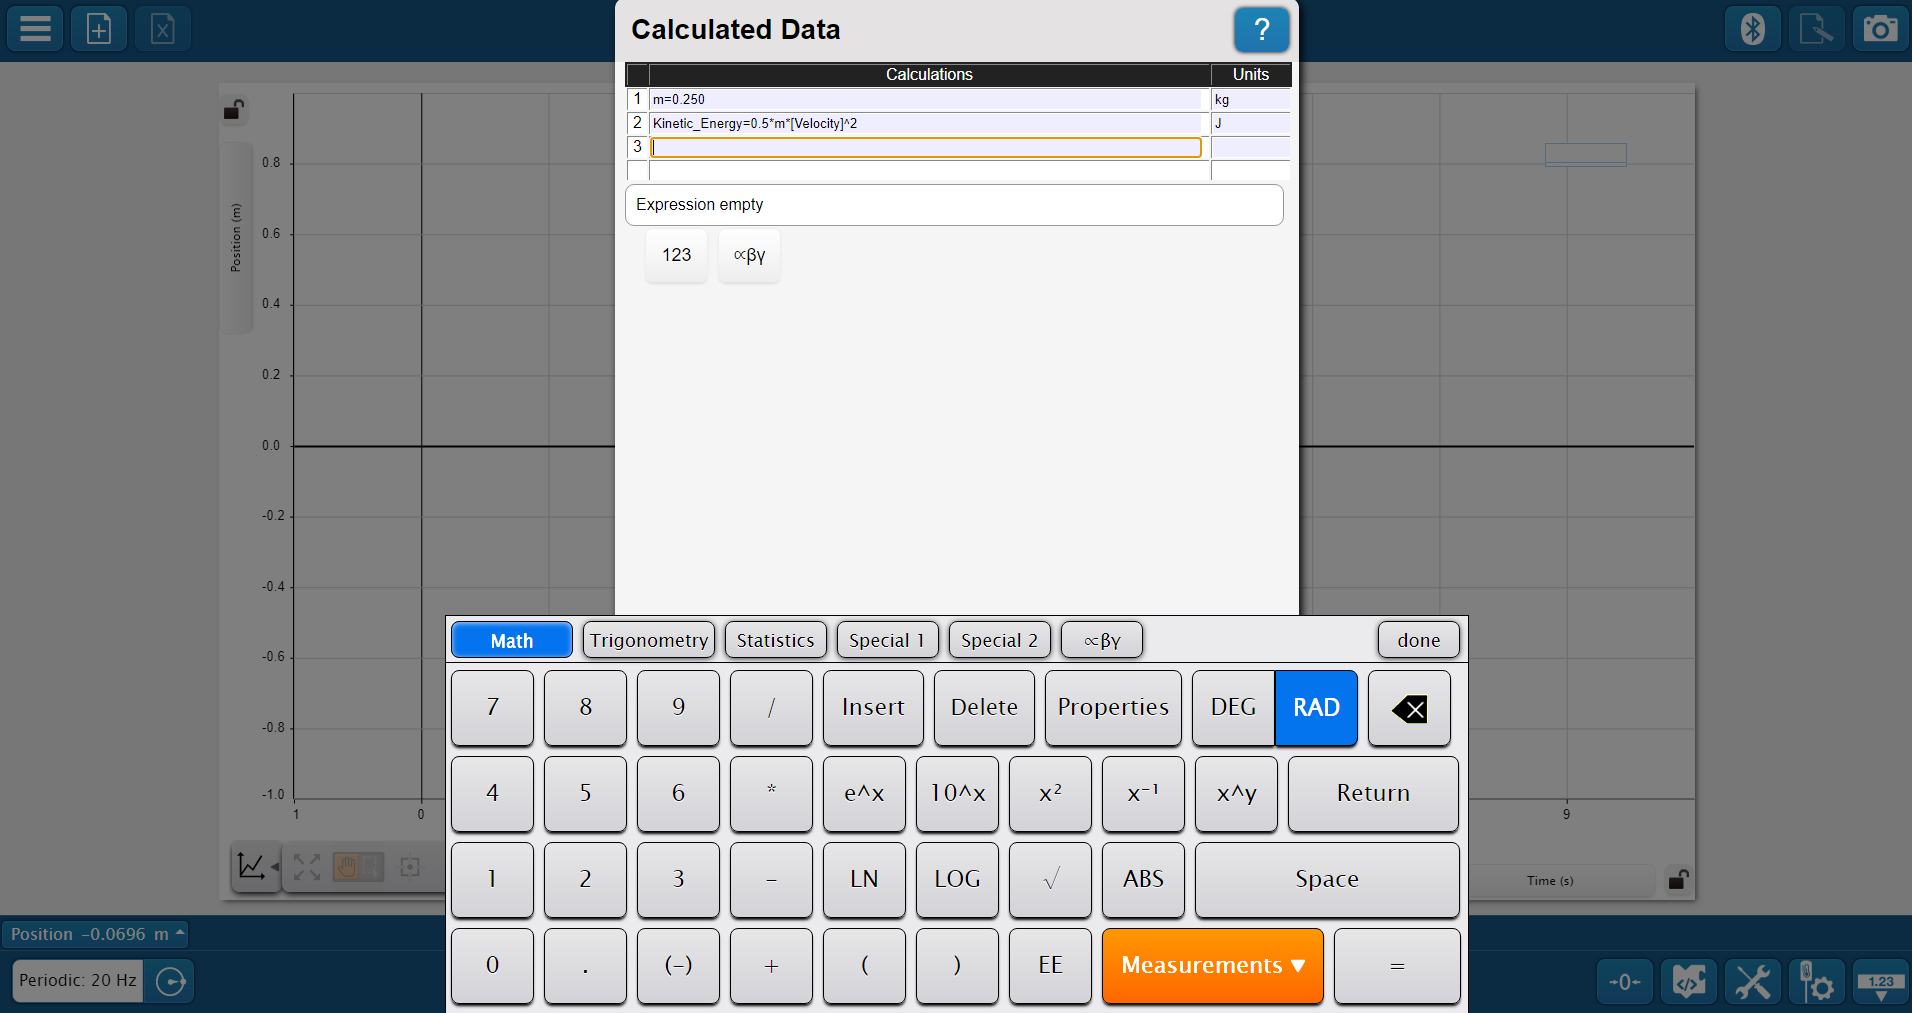
- From the Experiment Screen, open the Calculator by clicking Experiment Tools
 and selecting Calculated Data.
 -
In the Calculations column, enter a name for the calculation followed by an equals operator
=.Note
Calculation names cannot contain a space.
-
Enter the calculation on the right side of the
=sign, as shown above.- To insert a measurement, click the Measurements button, then select a measurement from the list.
- To insert a function or operator, use the function buttons. Click the calculator keyboard button
 if the calculator buttons aren't appearing on the screen. See Function descriptions for explanations on how to use each function in the calculator.
Note
If your calculation contains a constant (such as m in the example pictured above), the Calculator automatically creates a definition for the constant on the following line. You need to provide a value for the constant for the equation to be valid.
-
Repeat Steps 2 and 3 as needed until all desired calculations and constants are entered.
- If desired, enter a unit for each defined variable and constant by typing them into the corresponding box in the Units column.
-
Select Done, then select OK.
Note
If the Calculator detects that one or more equations entered are invalid, the OK option will be disabled. To quickly check for errors, select each line in turn and look for any lines for which an "Invalid expression" message appears underneath the table of calculations.
Display a calculation
Visualize calculated data by showing it in a data display, such as a graph.
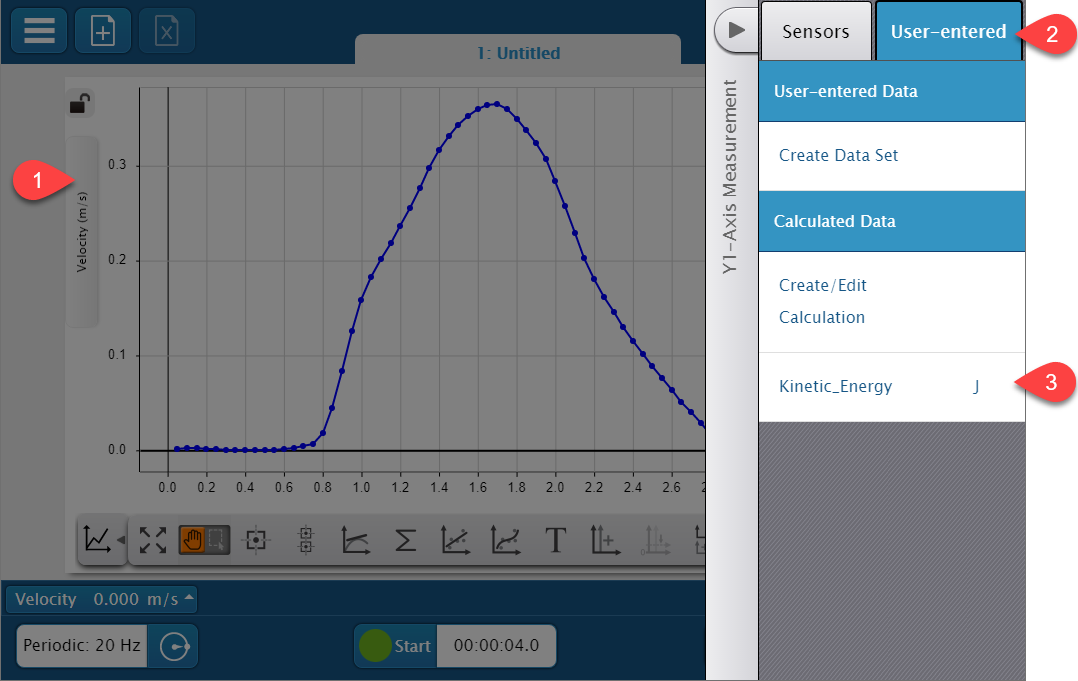
- Click the current measurement in the display.
- In the measurement pane, click the User-entered tab.
- Under Calculated Data, select the calculation you want to display.
Function descriptions
This reference provides descriptions of each function included in the Calculator.
Math
-
e^x
Raises e to the x power.
exp(x)x= data or value -
10^x
Raised 10 to the succeeding value.
-
x2
Squares the preceding value.
-
x-1
Inverts the preceding value.
-
x^y
Raises x to the y power.
-
LN
Calculates the natural logarithm of x.
ln(x)x= data or value -
LOG
Calculates the logarithm (base 10) of x.
log(x)x= data or value -
√
Calculates the square root.
sqrt(x)x= data or value -
ABS
Calculates the absolute value of x.
abs(x)x= data or value
Trigonometry
-
SIN
Trigonometric sine function.
sin(x)x= data or value -
COS
Trigonometric cosine function.
cos(x)x= data or value -
TAN
Trigonometric tangent function.
tan(x)x= data or value -
SIN-1
Trigonometric arcsine function.
arcsin(x)x= data or value -
COS-1
Trigonometric arccosine function.
arccos(x)x= data or value -
TAN-1
Trigonometric arctangent function.
arctan(x)x= data or value
Statistics
-
Σ min
Determines the running minimum value of the data source x.
min(x)x= data only -
Σ max
Determines the running maximum value of the data source x.
max(x)x= data only -
Σ avg
Calculates the running average value (mean) of the data source x.
avg(x)x= data only -
Σ σ
Calculates the running standard deviation of the data source x.
stddev(x)x= data only -
Σ count
Calculates the running count (number of data points) of the data source x.
count(x)x= data only -
Σ sum
Calculates the running sum of the data source x.
sum(x)x= data only
Special 1
-
integral
Calculates the numerical integral of the data source y with respect to the data source x by determining the running sum of the area under each y data point with respect to its corresponding x data point.
integral(y,x)y= data onlyx= data only -
derivative
Calculates the numerical derivative of the data source y with respect to the data source x by calculating the slope of a line segment from one data point in the sequence to a second data point in the sequence n-1 points away. If n = 2, the derivative values will be the slope between the first and second point, second and third point, and so on. If n = 5, the derivative values will be the slope between the first and fifth point, second and sixth point, third and seventh point, and so on.
derivative(n,y,x)n= integer value ≥ 2y= data onlyx= data only -
first
Returns a data set with all values equal to the first value of the data source x. The length of the returned data set will be identical to the length of the data source x.
first(x)x= data only -
period
Determines the period of the data source x (assuming it is oscillating) by detecting peaks in the data and measuring the time between peaks. The values 'peak%' and 'valley%' set the thresholds to finding the peaks in the data source x. If peak% and valley% are both equal to 10, the function searches for peaks in the top and bottom 10% of the data range. The value 'time' is the time range over which the algorithm is detecting peaks. The peak%, valley%, and time values can be adjusted to tune the function for best results.
period(peak%, valley%, time, x)peak%= value onlyvalley%= value onlytime= value onlyx= data only -
amplitude
Determines the amplitude of the data source x (assuming it is oscillating) by detecting peaks and valleys in the data and measuring half the thresholds to finding the peaks and valleys in the data source x. If peak% and valley% are both equal to 10, the function searches for peaks and valleys in the top and bottom 10% of the data range. The value 'time' is the time range over which the algorithm is detecting peaks and valleys. The peak%, valley%, and time values can be adjusted to tune the function for best results.
amplitude(peak%, valley%, time, x)peak%= value onlyvalley%= value onlytime= value onlyx= data only -
peakamp
Calculates half the distance between the maximum and minimum values in every time interval 'time' for the data source x.
peakamp(time, x)n= integer value ≥ 1x= data only
Special 2
-
filter
Returns a copy of the data source x with all values less than 'min' and greater than 'max' removed.
filter(min, max, x)min= value onlymax= value onlyx= data only -
smooth
Smooths the data from the data source x using the Savitzky-Golay method. Increasing n increases the amount of smoothing. The parameter n must be an odd number.
smooth(n, x)n= odd integer value ≥ 5x= data only -
avgfilter
Smooths the data from the data source x by averaging every n values into one value. The number of points in the resultant data set will have a factor of n fewer points than the original data source x.
avgfilter(n, x)n= integer value ≥ 2x= data only -
random
Returns a random value between zero and one.
random()
Unlisted functions
These functions do not have a corresponding button but can be entered into an equation by typing them in the Enter a calculation box.
-
timeof
Returns the Time values, or other independent variable values, associated with each value in the data source x.
timeof(x)x= data only