
Set the minimum and maximum axis values in a chart
The maximum and minimum axis values on a chart change automatically by default, which can sometimes make data difficult to view. You can fix this by setting static minimum and maximum axis values.
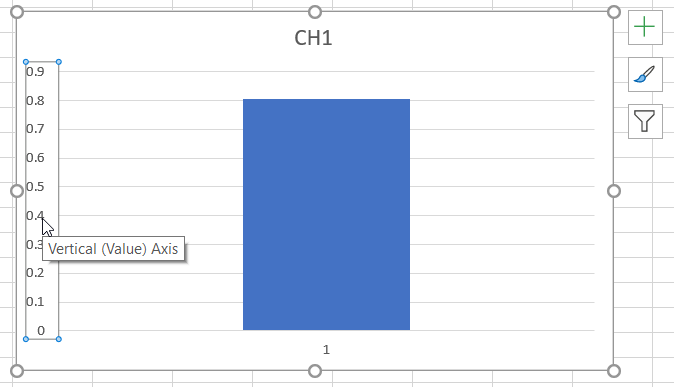
- Select the axis on the chart.
- Right-click the axis then select Format Axis in the menu. The Format Axis panel appears on the right side of the window.
- Under Axis Options in the Format Axis panel, set the minimum and maximum axis values by entering a value in the Minimum and Maximum boxes under Bounds.