
Stream Data
To stream data, connect a sensor to the PASCO Data Streamer app, then connect the app to Excel.
Step 1: Connect a Sensor to PASCO Data Streamer
- Open PASCO Data Streamer.
- Click the Bluetooth
 button.
 - Turn on a compatible PASCO Wireless Sensor.
- Select the sensor that matches its device ID.
- Repeat steps 3 and 4 to connect additional sensors.
- Click OK.
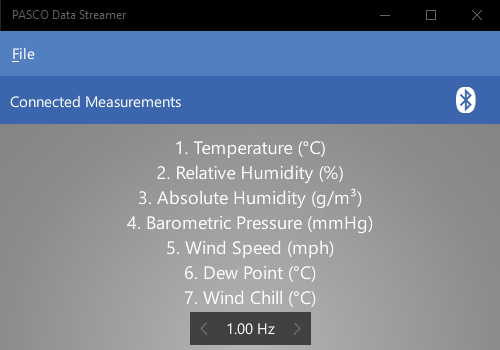
- Adjust the sample rate by clicking the left and right arrows.Note: Data Streamer supports sample rates between 1 and 100 Hz. You can only adjust the sample rate if the sensors connected support it.
PASCO Data Streamer displays a numbered list of available measurements. The numbers correlate with the channel numbers in the columns of the Data In spreadsheet in Excel.
Step 2: Connect PASCO Data Streamer to Excel
- Open Excel.
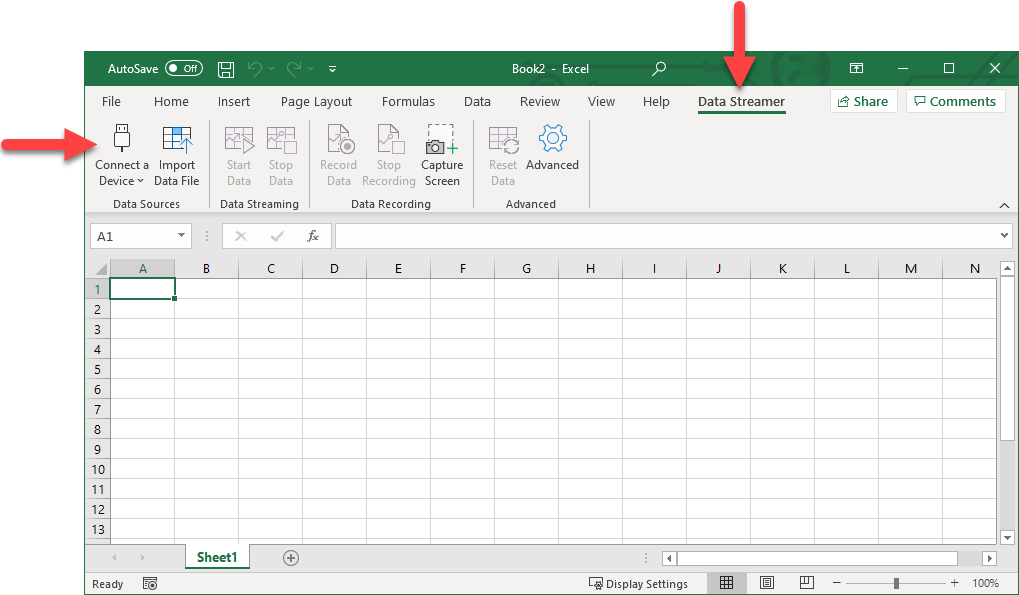
- Select the Data Streamer tab in the ribbon.
- Click Connect a Device
 , then select PASCO Data
Streamer
, then select PASCO Data
Streamer
 .
.
Note: Excel displays ten data channels by default. If you have connected a sensor with
more than 10 measurements available, go to the Settings sheet and change the number of data channels.
Step 3: Stream Data
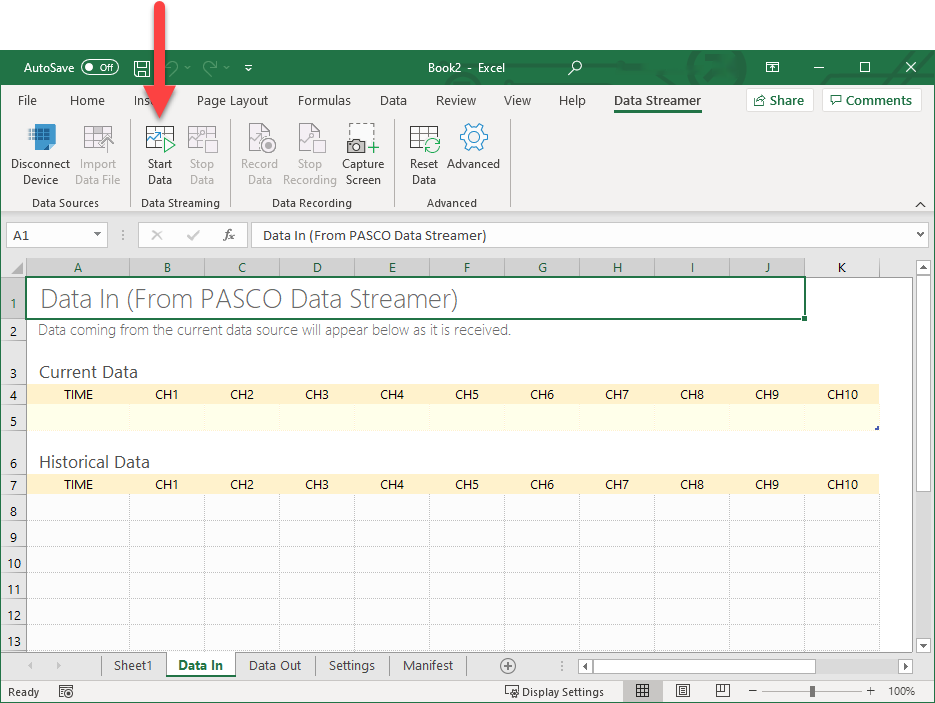
In the Data Streamer ribbon, click Start Data
![]() to start streaming data. Live data is
streamed (but not recorded) on the spreadsheet.
to start streaming data. Live data is
streamed (but not recorded) on the spreadsheet.
Next Steps
Once you have connected a sensor and started streaming data, you can record your data or display the live-streamed data in a variety of charts, such as a graph.